 Description
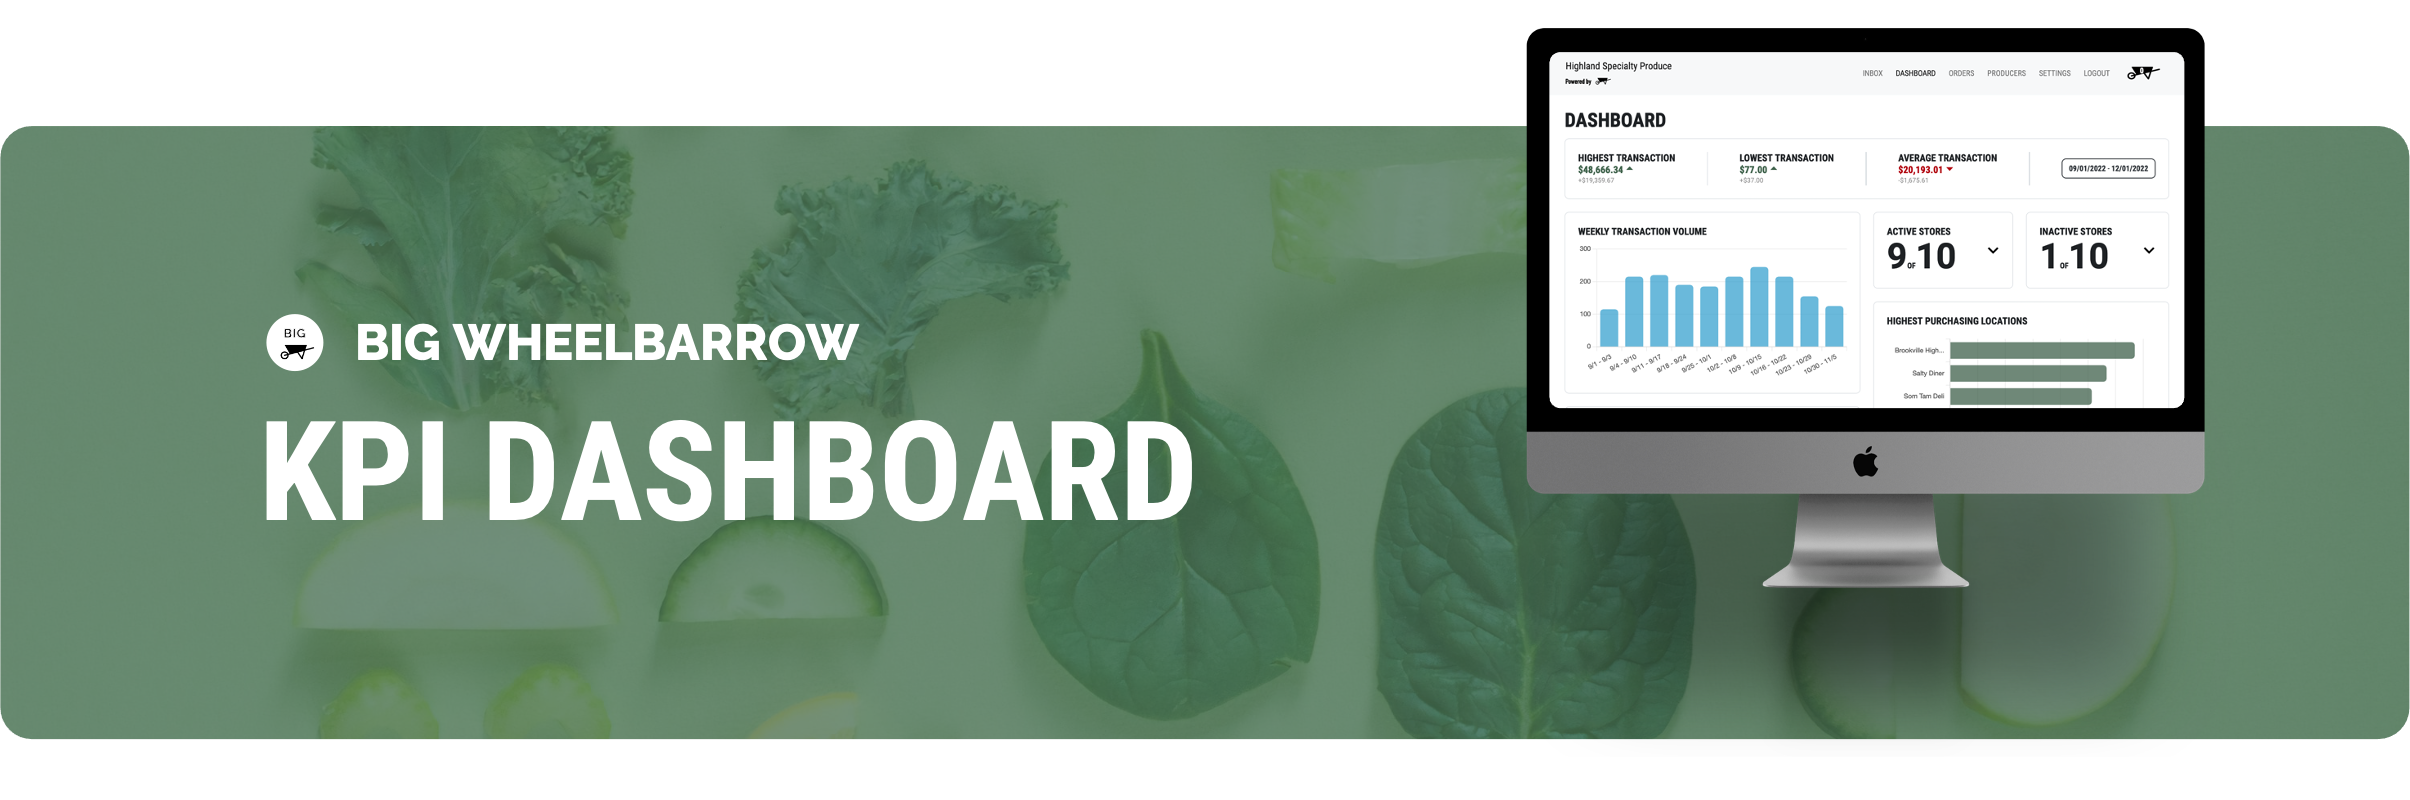
Between October and November of this year, I worked with a group of computer science and design students as a project manager to build a KPI dashboard for Big Wheelbarrow. This company helps smaller food producers break into the supply chain using their cloud inventory and order management system.
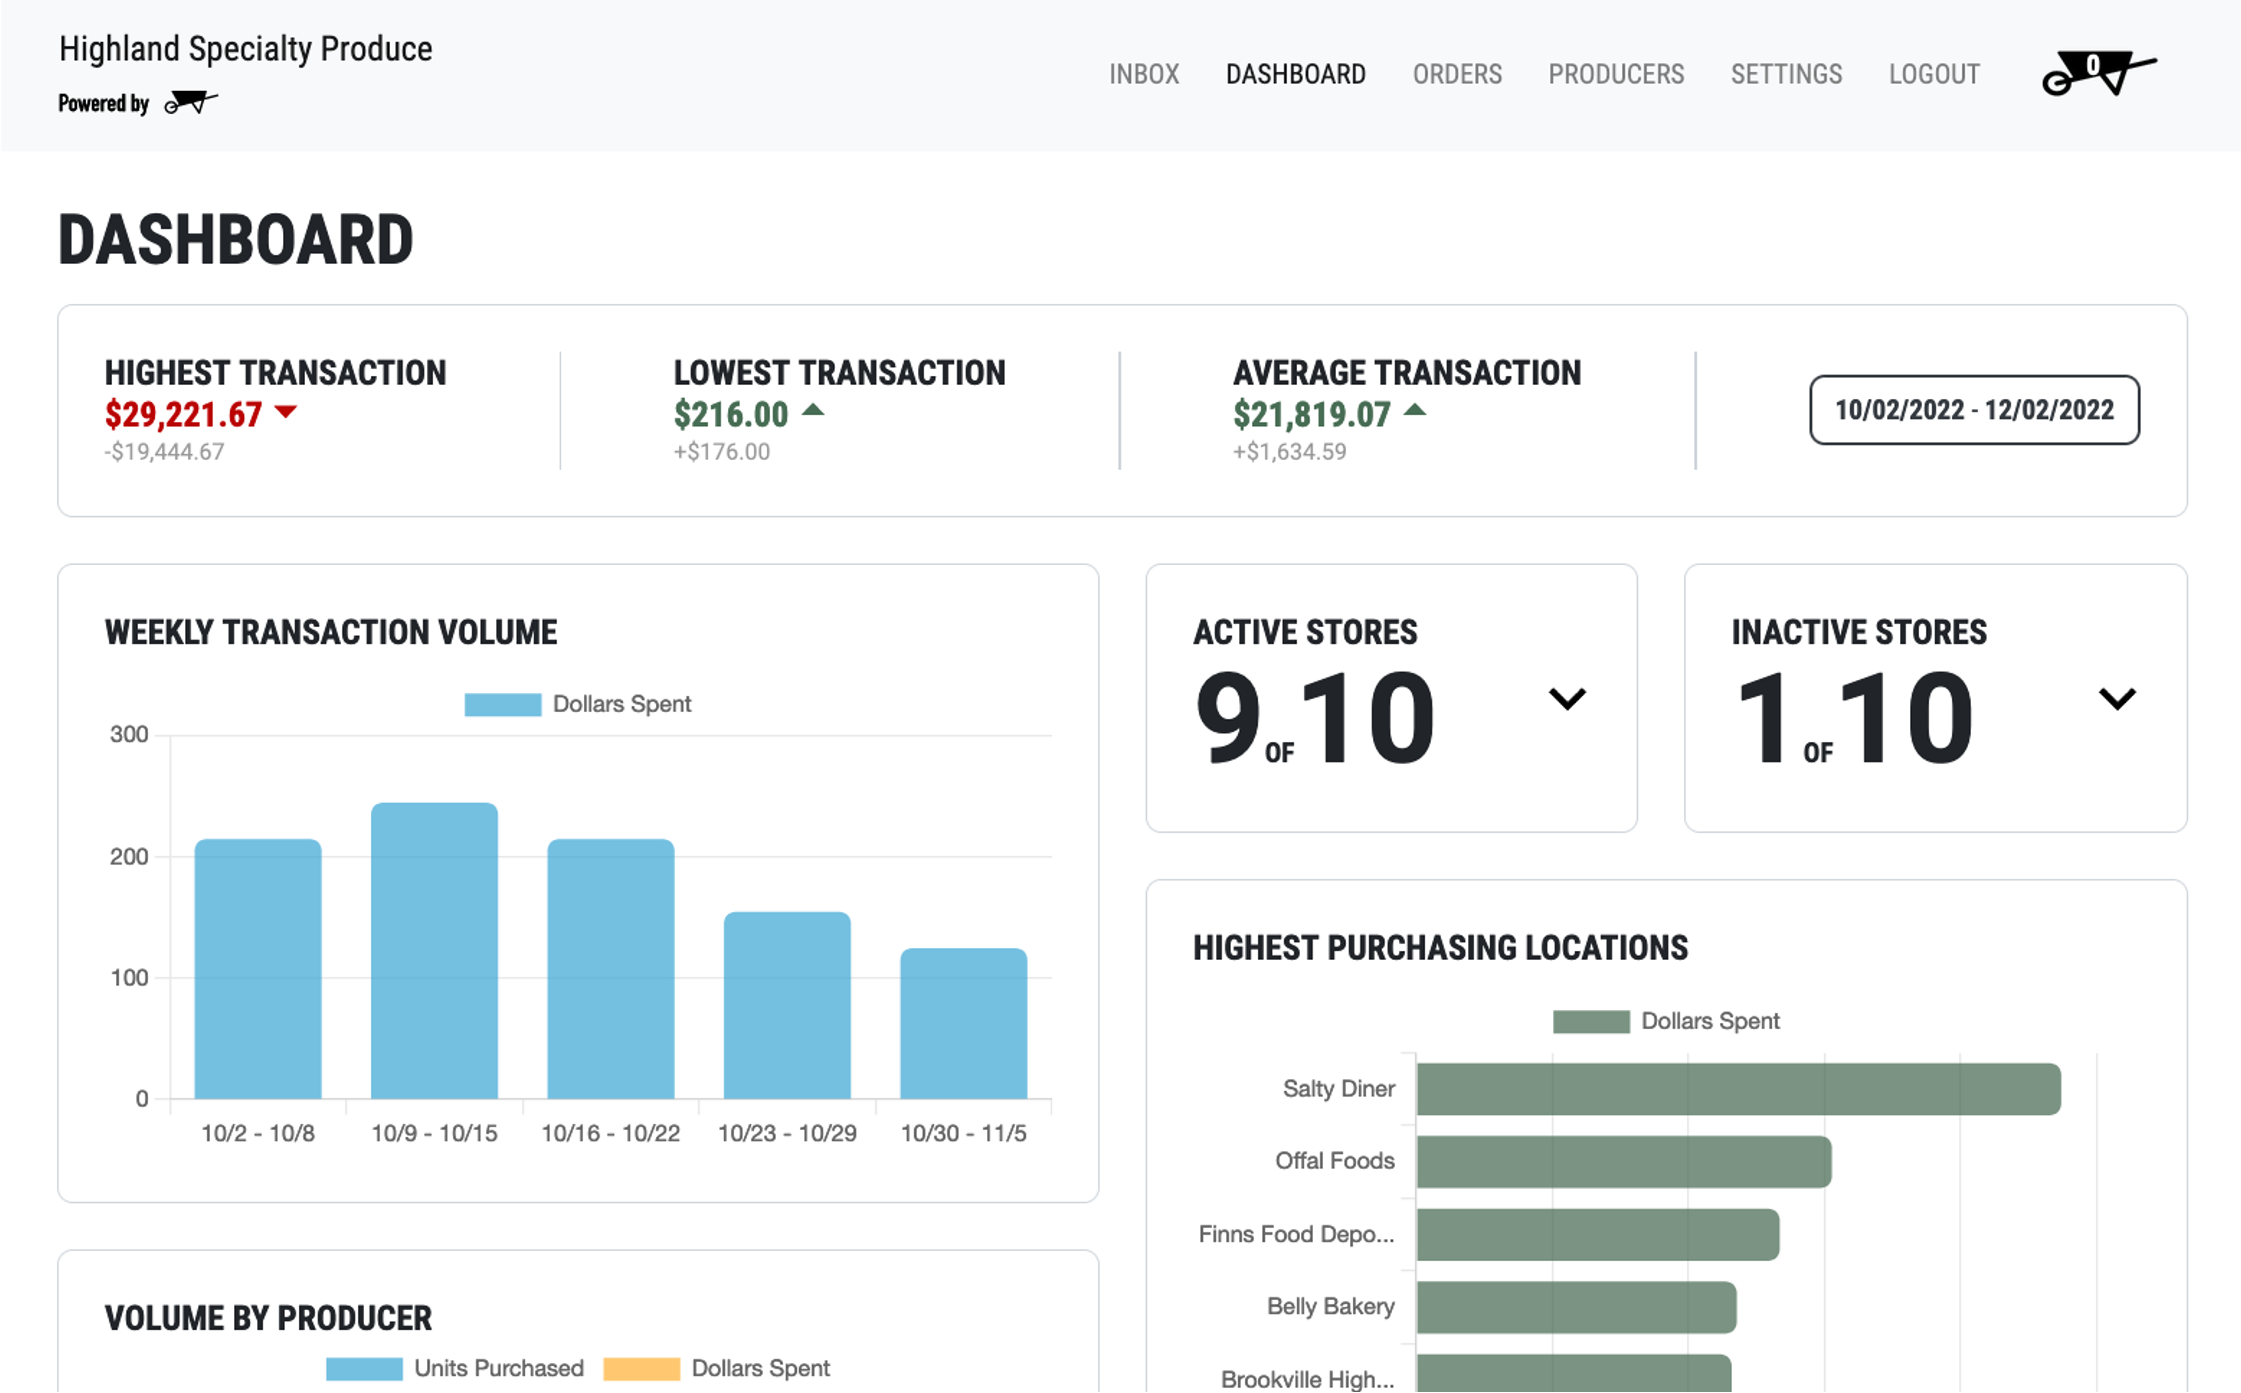
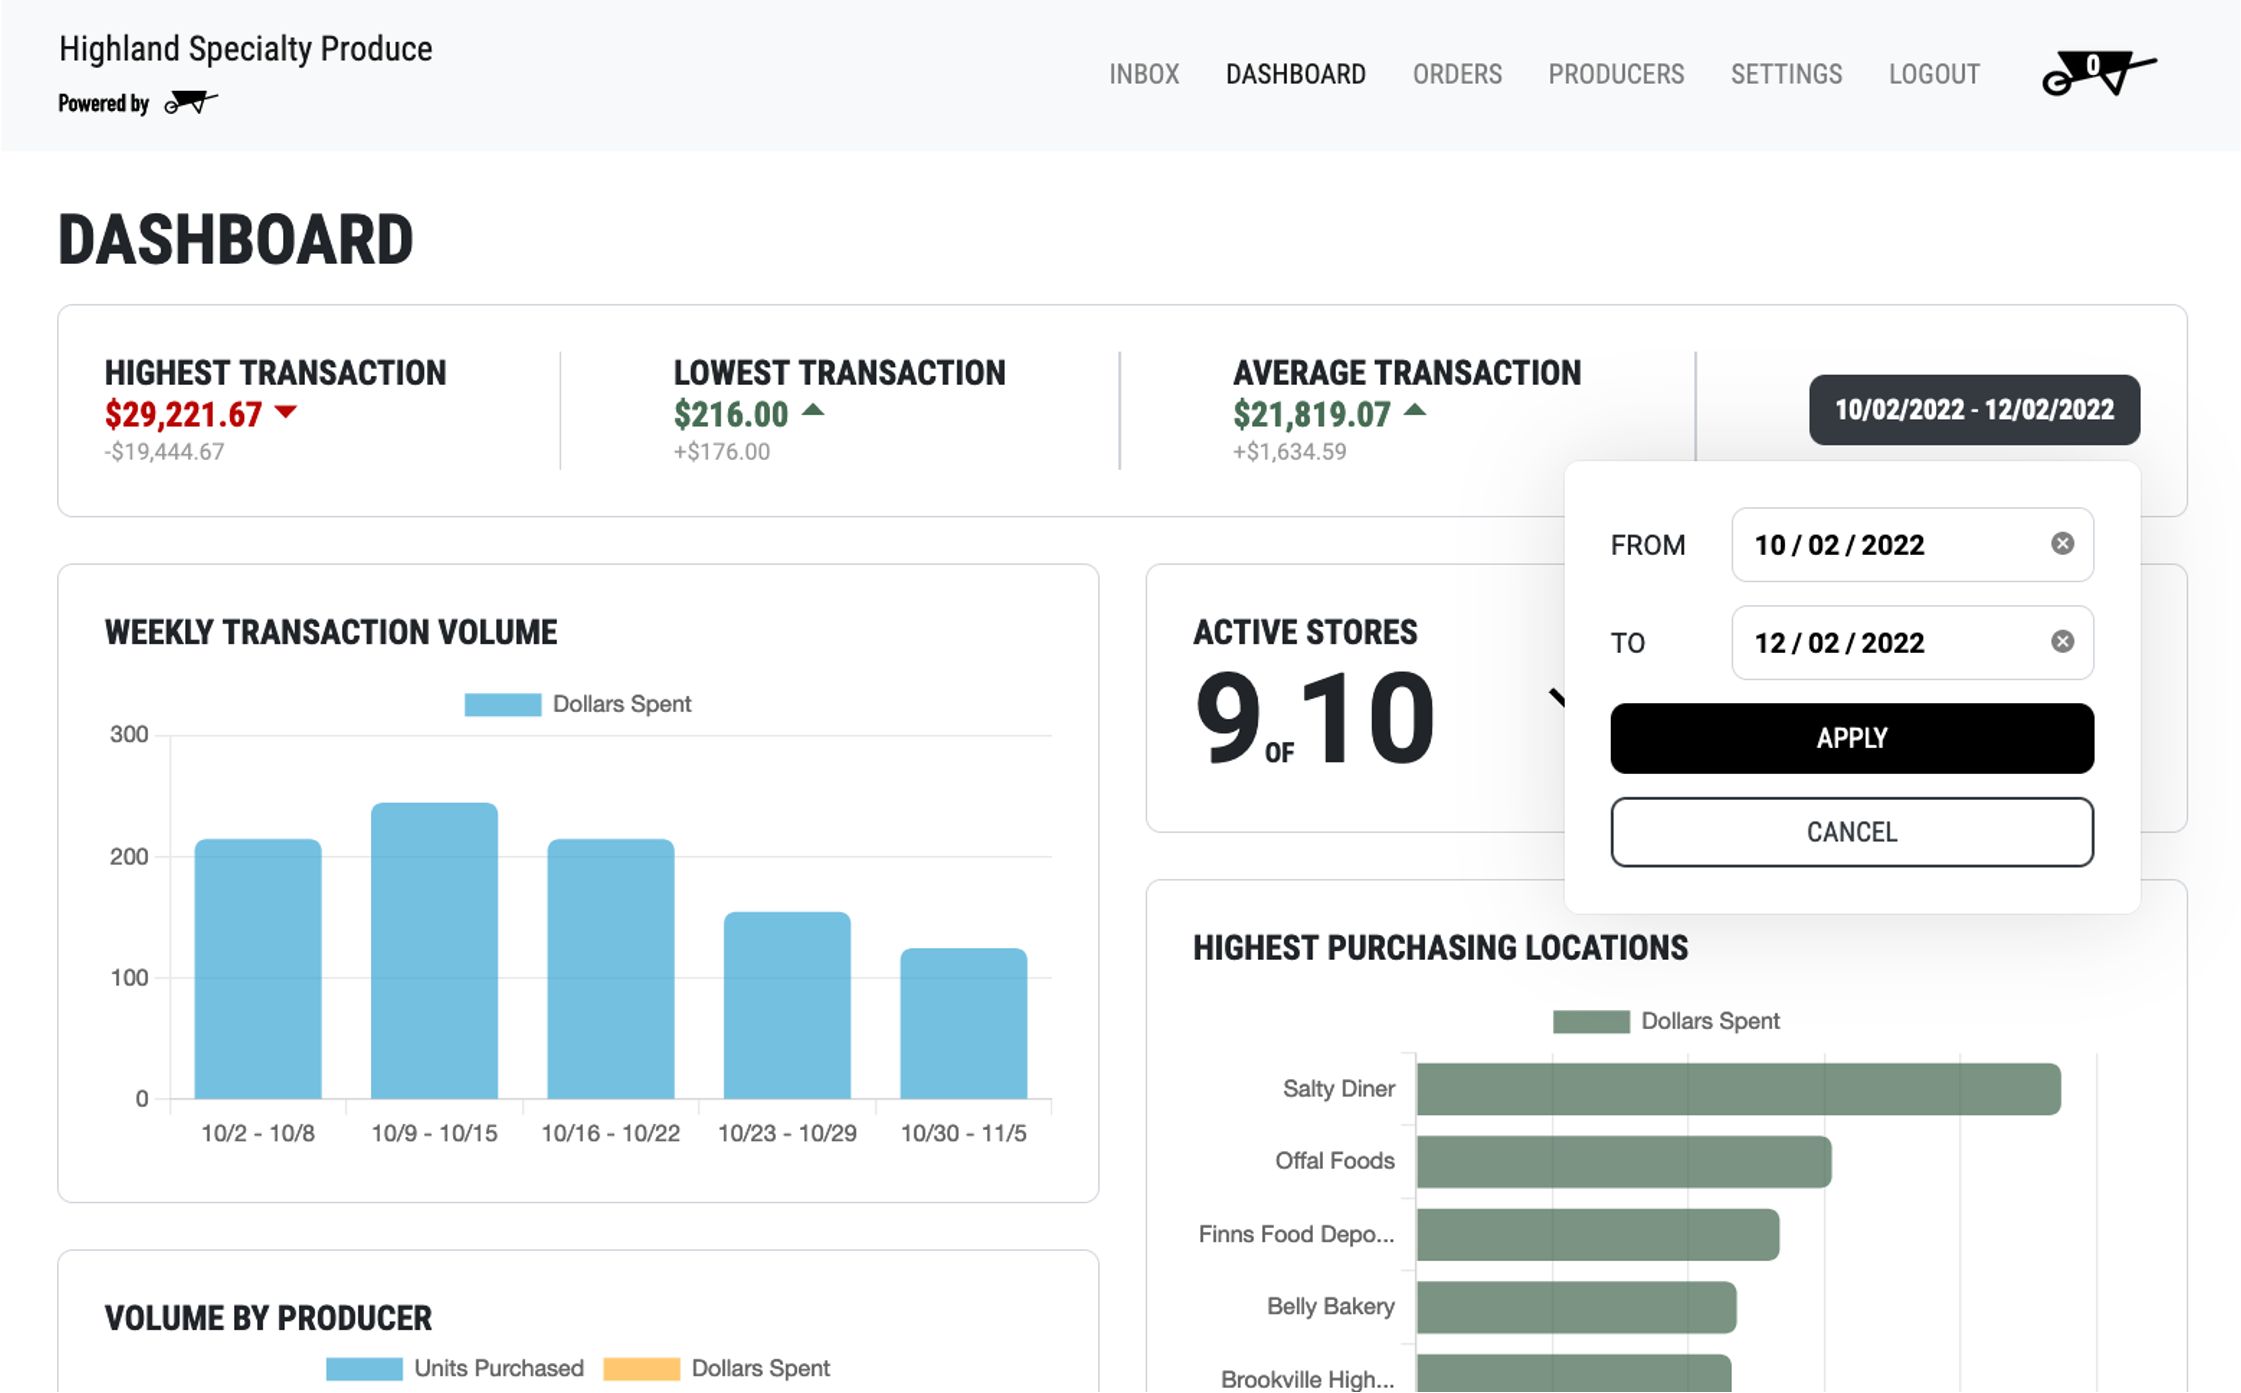
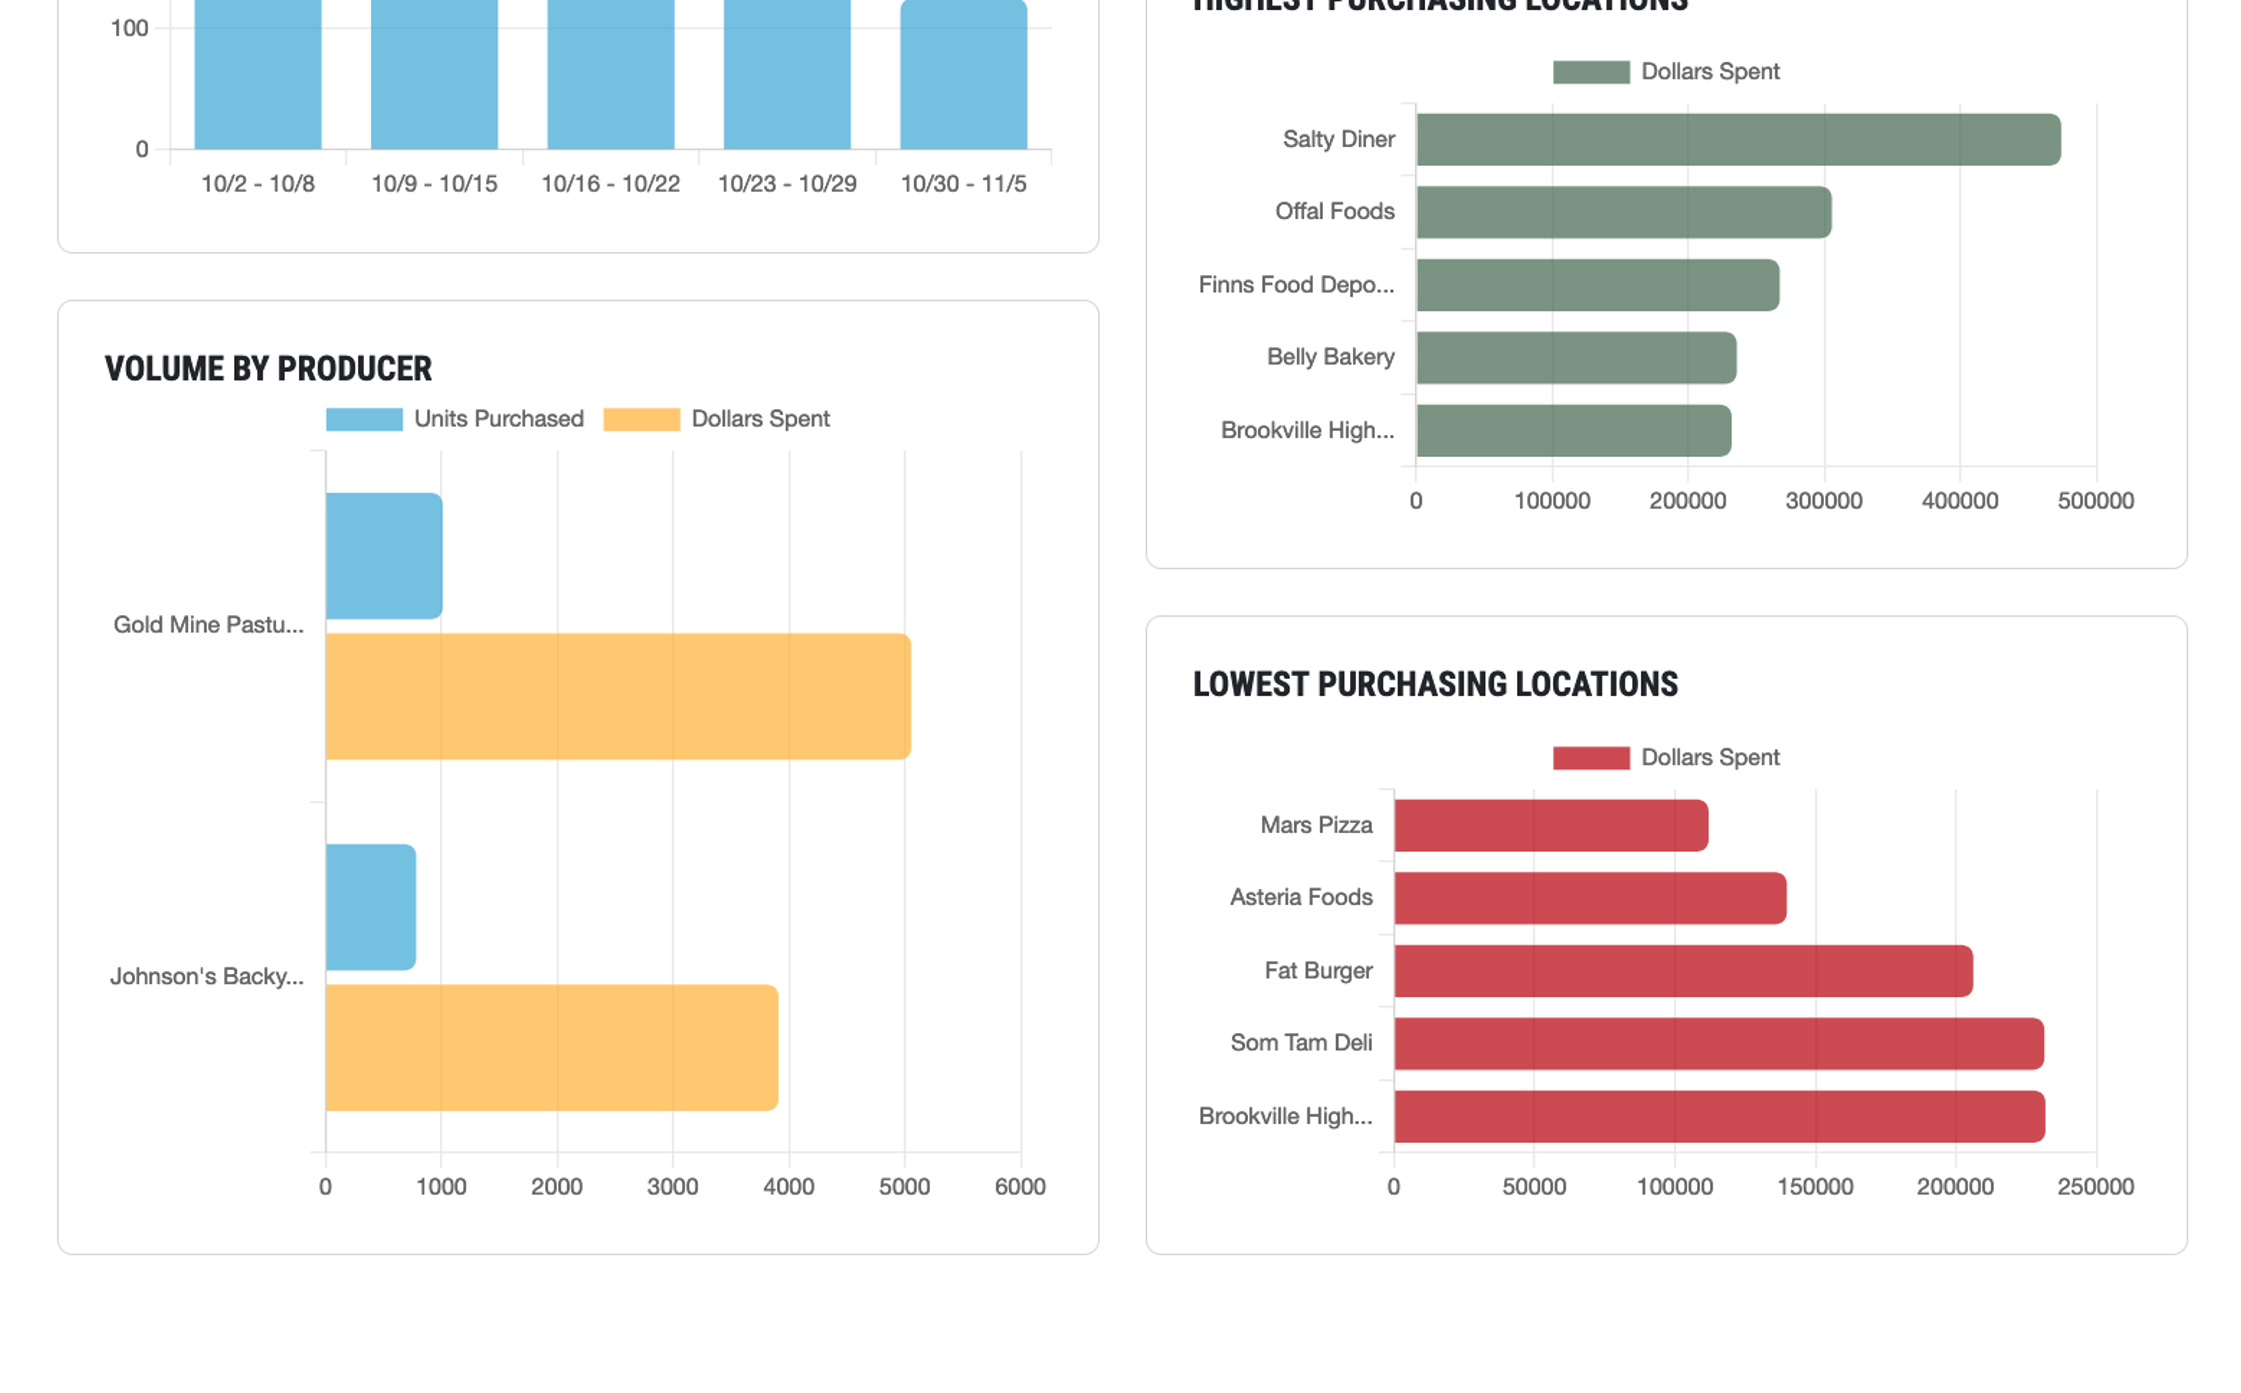
Our KPI dashboard collects relevant transaction data, such as gross transaction volume, for some time period using ActiveRecord queries and displays this data across several charts. Four charts display the weekly GTV, highest purchasing locations, lowest purchasing locations, and transaction volume (in both dollars and units) for every producer over the selected time period. Users can change the date range (which is communicated to the Rails server using WebSockets) to analyze performance over different periods of time.
We worked with Big Wheelbarrow as members of CodeLab Davis, a software development and design agency run by UCD students. After we finished the project, I joined the CodeLab board as a project coordinator. Some of my new responsibilities include establishing new industry partnerships, organizing new projects, and overseeing teams (as well as contributing code) throughout our next term!
If you’d like to learn more (and meet the rest of the team), please read our project writeup on Medium.
 Technologies and Languages
We built this dashboard using Ruby on Rails and Stimulus, a lightweight JavaScript framework that provides additional reactivity to your websites and web applications. Data was retrieved from a PostgreSQL database using WebSockets and displayed using Chartkick charts.
 Desktop Screenshots